


 85 / 123

Introduction
NATIONAL
CONTRIBUTION REPORT
Beyond Short-
Term Profits
Nurturing People
Process Excellence
& Governance
Planet & Society
Our Associates
NATIONAL CONTRIBUTION REPORT 67
Axiata Group Berhad | Sustainability & National Contribution Report 2016
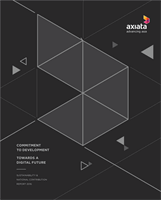
Economic and Financial Contributions
Celcom’s Gross Value Added (GVA) in
2016 was estimated at USD1,646 million
comprising direct operational contributions
of USD770 million, indirect operational
contributions of USD733 million and capital
investments of USD142million (see Figure 1).
Total GVA of USD1,646 million was derived
from Celcom’s total opex of USD990
million and capex of USD321 million, which
means that every USD1 spent by Celcom in
Malaysia through its operations and capital
investment added USD1.4 to the Malaysian
economy.
Investing and Innovating for the Long
Term
Celcom invested a total of USD1,350 million
between 2012 and 2016 towards improving
its products and services, expanding
its network coverage, introducing new
technologyandenhancing its infrastructure
for the Malaysian market. Total investment
of USD321 million in 2016 represented a
41% increase compared to USD228 million
in 2015 (see Figure 2). The strong trend of
investment supports the OpCo’s long-term
development and continuing contributions
to the Malaysian economy.
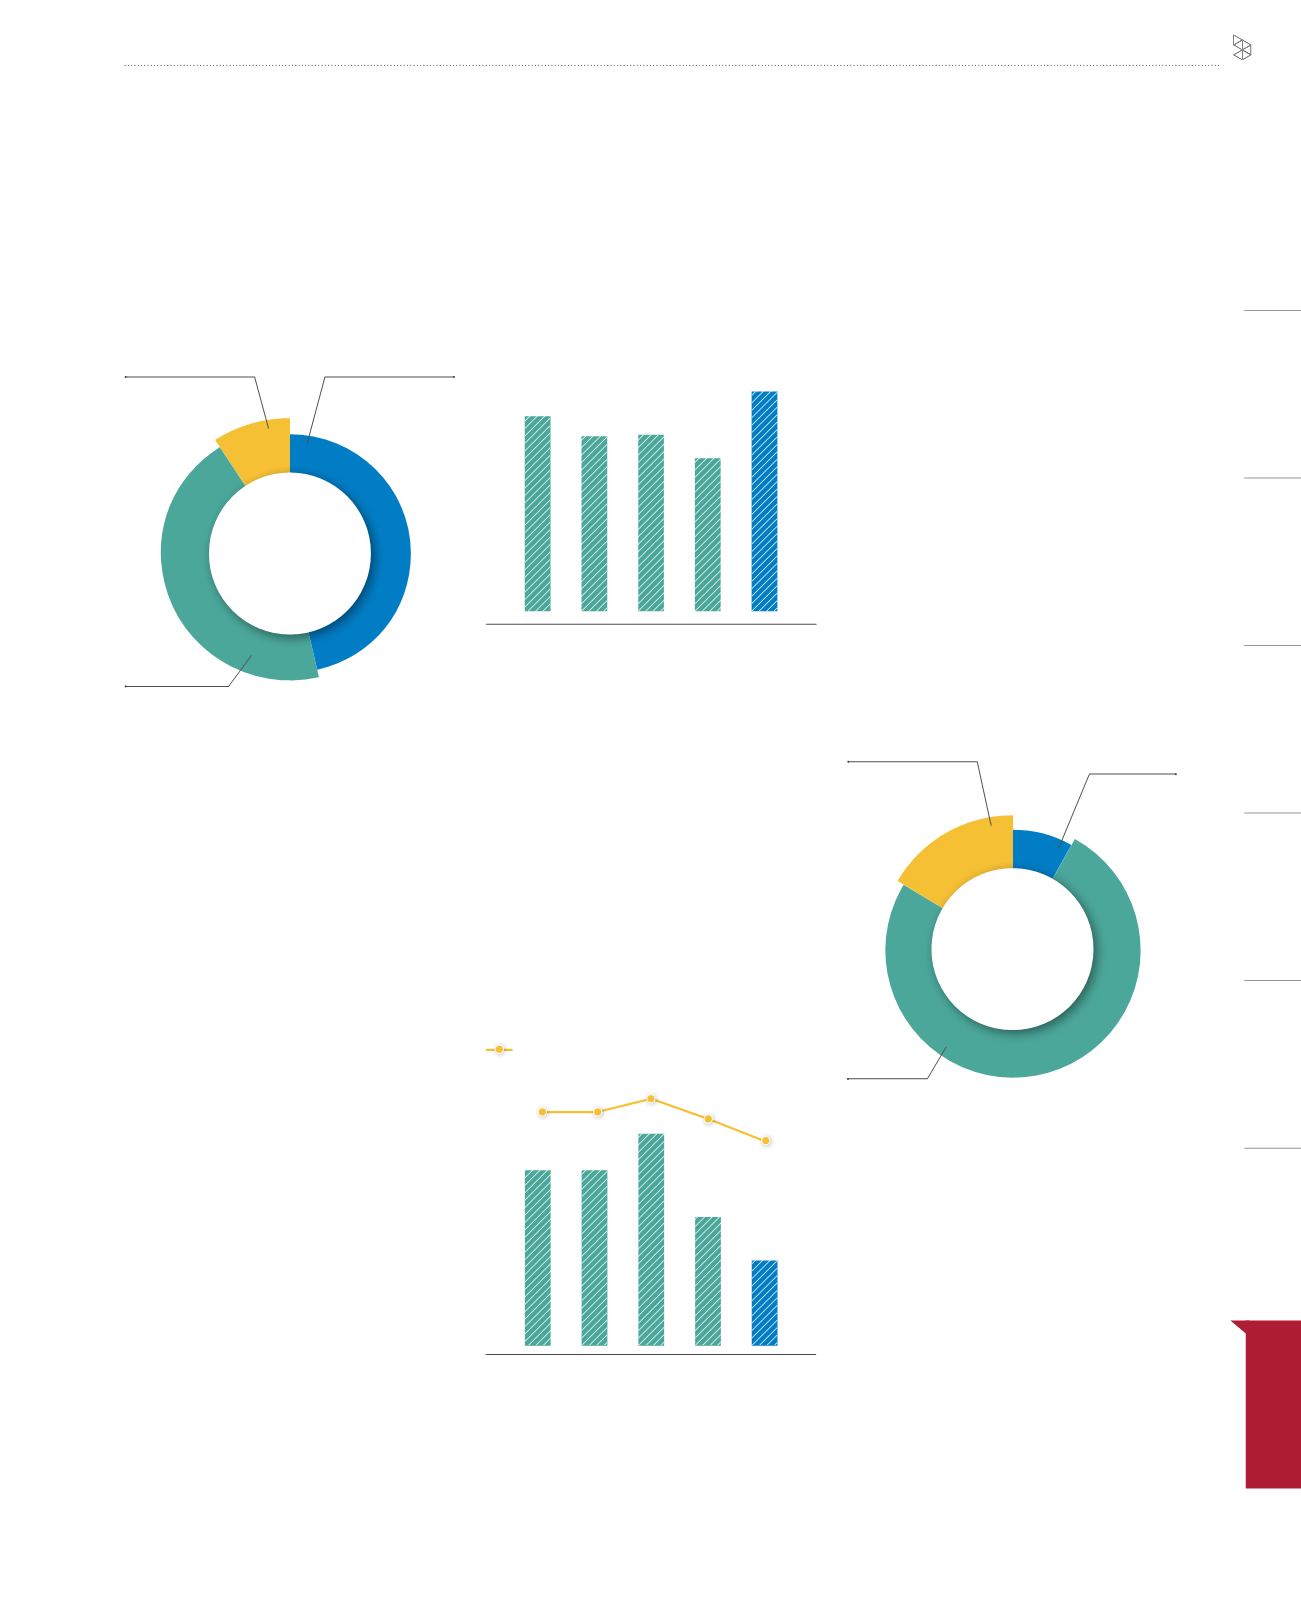
Contributions to Public Finance
Total tax contributions for Celcom over the
last five years totalled USD1,677 million.
In 2016, Celcom contributed USD200
million in tax, accounting for 0.5% of the
Malaysian Government’s total tax revenue
(see Figure 3). Celcom’s tax commitments
in Malaysia include direct taxes such as
corporate and withholding tax, as well as
indirect taxes such as value-added tax and
licensing fees.
Talent Development
Celcom provided 3,687 direct jobs in
2016 of which 99.5% were staffed by
Malaysian citizens (see Figure 4). About
44% of Celcom employees were women,
which is higher than the national average
of 38%. During the year, Celcom engaged
six graduate management trainees as
part of its goal to provide young people
with specialist skills required in the digital
economy. Celcom’s operations also
indirectly supported an additional 34,900
jobs through its engagement with suppliers,
and a further 7,622 jobs through Celcom’s
capital investments.
Figure 2: Total capital investment:
2012-2016
Figure 1: GVA contribution to the
Malaysia economy 2016
Figure 4: Total employment impact 2016
7,622
3,687
34,872
Supported by
capital investment
Directly
employed
Operations - indirectly supported
76%
16% 8%
46,181
Jobs
supported
47%
45%
9%
USD142 million
USD770 million
USD733 million
GVA by capital
investment
Operational
direct GVA
Operational Indirect and Induced GVA
USD1,646
million
2012
286
256 258
228
321
USD million
2013 2014 2015
2016
Note: As a % of total GVA contribution; Numbers may not balance due to rounding
Figure 3: Total tax contributions to
public finance, 2012-2016
2012
373 376
441
288
200
USD million
2013 2014 2015
2016
0.8% 0.8%
0.9%
0.7%
0.5%
as a % of general Government tax revenue
Note: Total tax revenue for the Federal Government.
(Source: 2012-2016 budget, Ministry of Finance)
In Support of the National Agenda
Celcom is committed to forwarding
the national agenda of developing the
capacities and capabilities of Bumiputera
and other stakeholders. In addition to
its vendor development programme,
Celcom sets key performance indicators
benchmarking its contribution to national
development. These include:
(i)
Developing Entrepreneurs
- Measuring procurement spend
through Bumiputera vendors (73%
or RM606 million in 2016)
NATIONAL CONTRIBUTION
REPORT