


 93 / 123

Introduction
NATIONAL
CONTRIBUTION REPORT
Beyond Short-
Term Profits
Nurturing People
Process Excellence
& Governance
Planet & Society
Our Associates
NATIONAL CONTRIBUTION REPORT 75
Axiata Group Berhad | Sustainability & National Contribution Report 2016
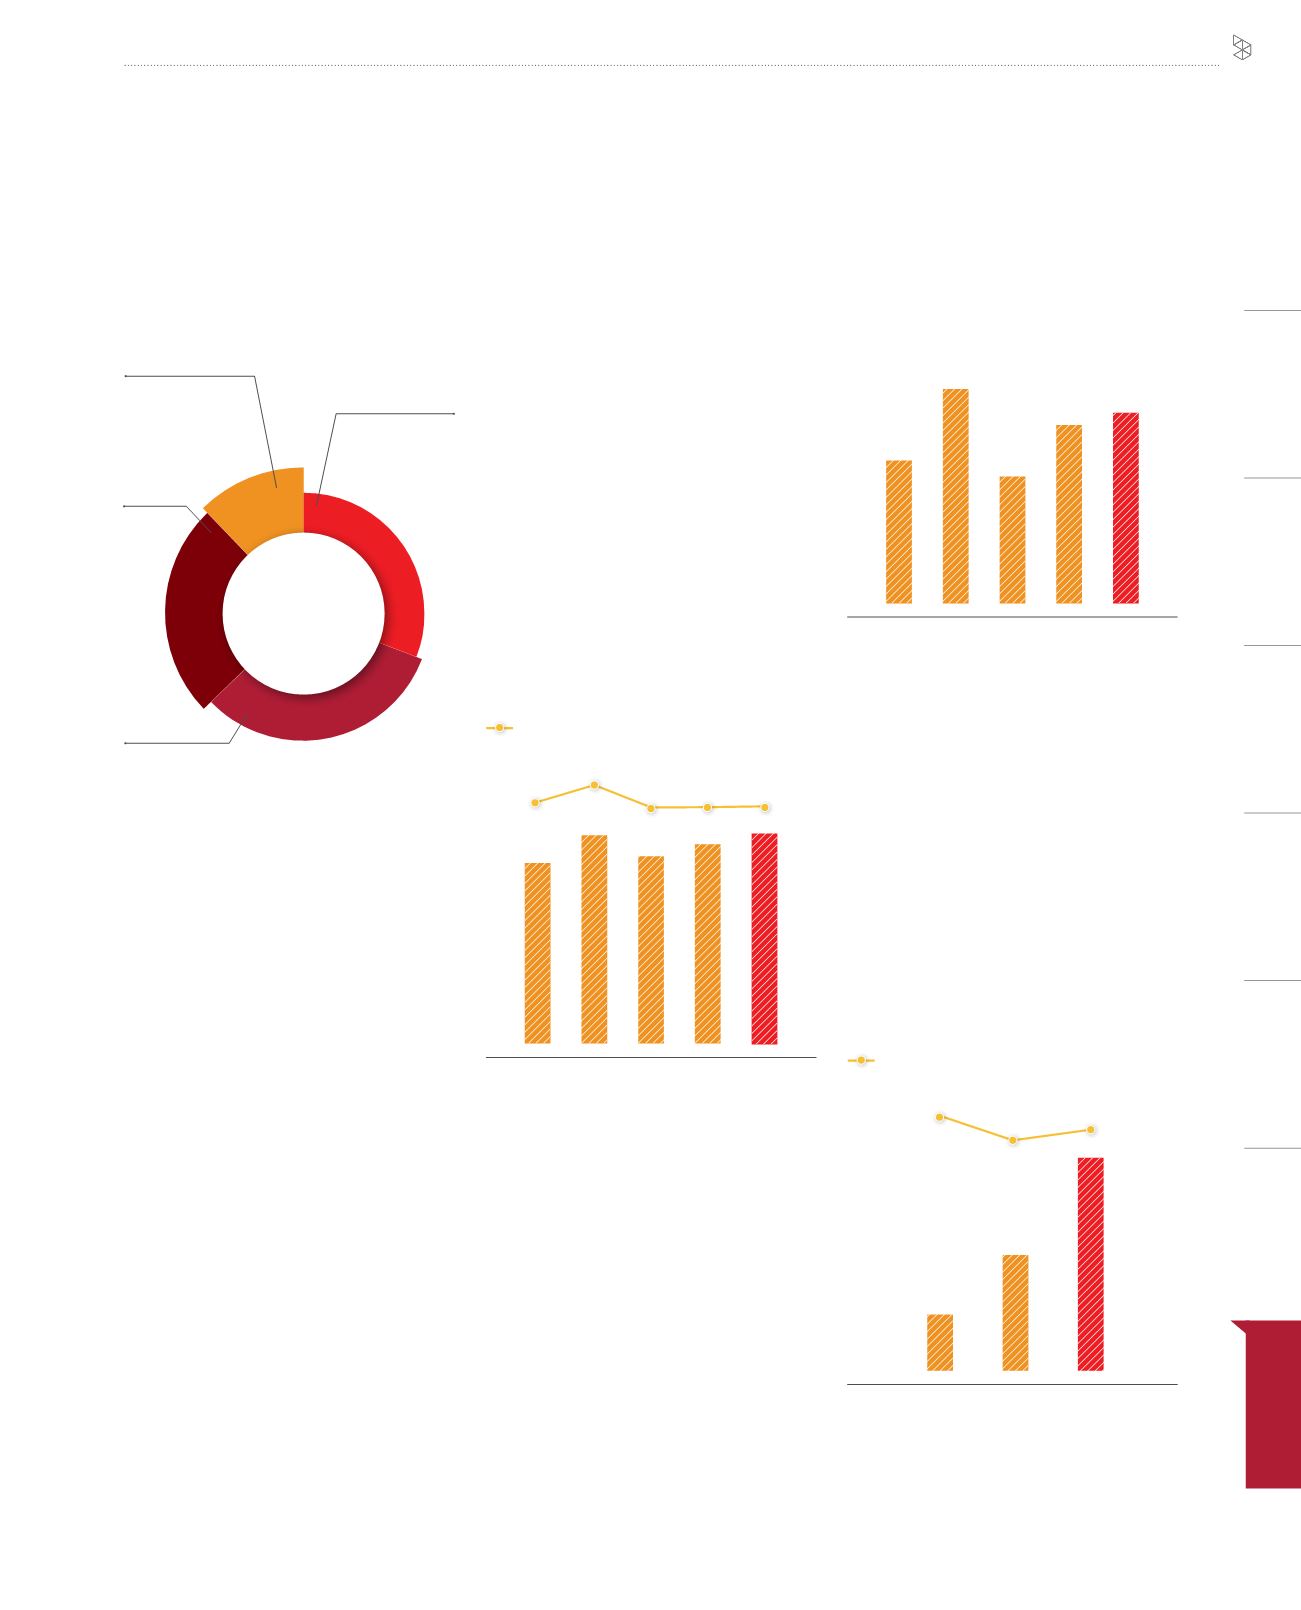
Figure 2: GVA contribution to the Sri
Lankan economy, 2012-2016
Figure 3: Total capital investment:
2012-2016
Figure 1: GVA contribution to the Sri
Lankan economy 2016
USD93 million
USD250 million
USD257 million
USD203 million
GVA by capital
investment
Operational
direct GVA
Operational Indirect and Induced GVA
GVA by
productivity
31%
32%
25%
12%
USD804
million
Economic and Financial Contributions
Dialog’s Gross Value Added (GVA)
in 2016 was estimated at USD804
million comprising direct operational
contributions of USD250 million, indirect
operational contributions of USD257
million, capital investment contributions
of USD93 million and productivity gains of
USD203 million (see Figure 1). Productivity
gains are defined as the improvement in
national productivity due to the rise in
mobile penetration rate. The total GVA of
USD804 million was derived from Dialog’s
total opex and capex of USD386 million
and USD180 million respectively, and the
4.8% increase in the mobile penetration
rate. Every USD1 spent by Dialog in Sri
Lanka through its operations and capital
investment added USD1.2 in GVA to the Sri
Lankan economy in 2016.
Dialog’s total GVA contribution increased
to USD804 million in 2016 from USD693
million in 2012, translating to a CAGR of
3.8% (see Figure 2). The improving trend
was due to increased operational profits
and a surge in the number of subscribers.
Over the last five years, total operational
profit grew to USD208 million in 2016
from USD142 million in 2012. The total
number of mobile subscribers in Sri Lanka
expanded to 26 million from 19 million
during the same time period translating to
a mobile penetration rate of 122% in 2016
(95% in 2012).
Contributions to Public Finance
Total tax contributions for Dialog from 2014
to 2016 totalled USD603 million, expanding
to USD217 million in 2016 from USD198
million in the previous year (see Figure 4).
Dialog’s tax contributions in 2016 accounted
for 2.2% of the Sri Lankan Government’s
total tax revenue. DIalog’s tax commitments
in Sri Lanka include direct taxes such as
corporate and withholding tax, as well as
indirect taxes such as value-added tax and
licensing fees.
2012
133
201
116
167
180
USD million
2013 2014 2015
2016
Investing and Innovating for the Long
Term
Dialog invested a total of USD799 million
between 2012 and 2016. The OpCo’s total
investment of USD180 million in 2016
represented a 7.9% increase from USD167
million in 2015 (see Figure 3). Dialog is
committed to further investing in Sri Lanka
so as to enhance its network coverage
and service quality in an increasingly
competitive market.
2012
693
803
717
765
804
USD million
2013 2014 2015
2016
1.1%
1.2%
1.0% 1.0% 1.0%
as a % of total GDP
Note: As a % of total GVA contribution; Numbers may not balance due to rounding
Figure 4: Total tax contribution to
public finance, 2014-2016
as a % of general Government tax revenue
2014
USD million
2015
2016
187
2.5%
2.1%
2.2%
198
217
Note: 2014-2016 General Government tax revenue
data is from Budget estimates 2015-2017, Ministry of
Finance, Sri Lanka
NATIONAL CONTRIBUTION
REPORT