


 112 / 123

94
Axiata Group Berhad | Sustainability & National Contribution Report 2016
APPENDIX
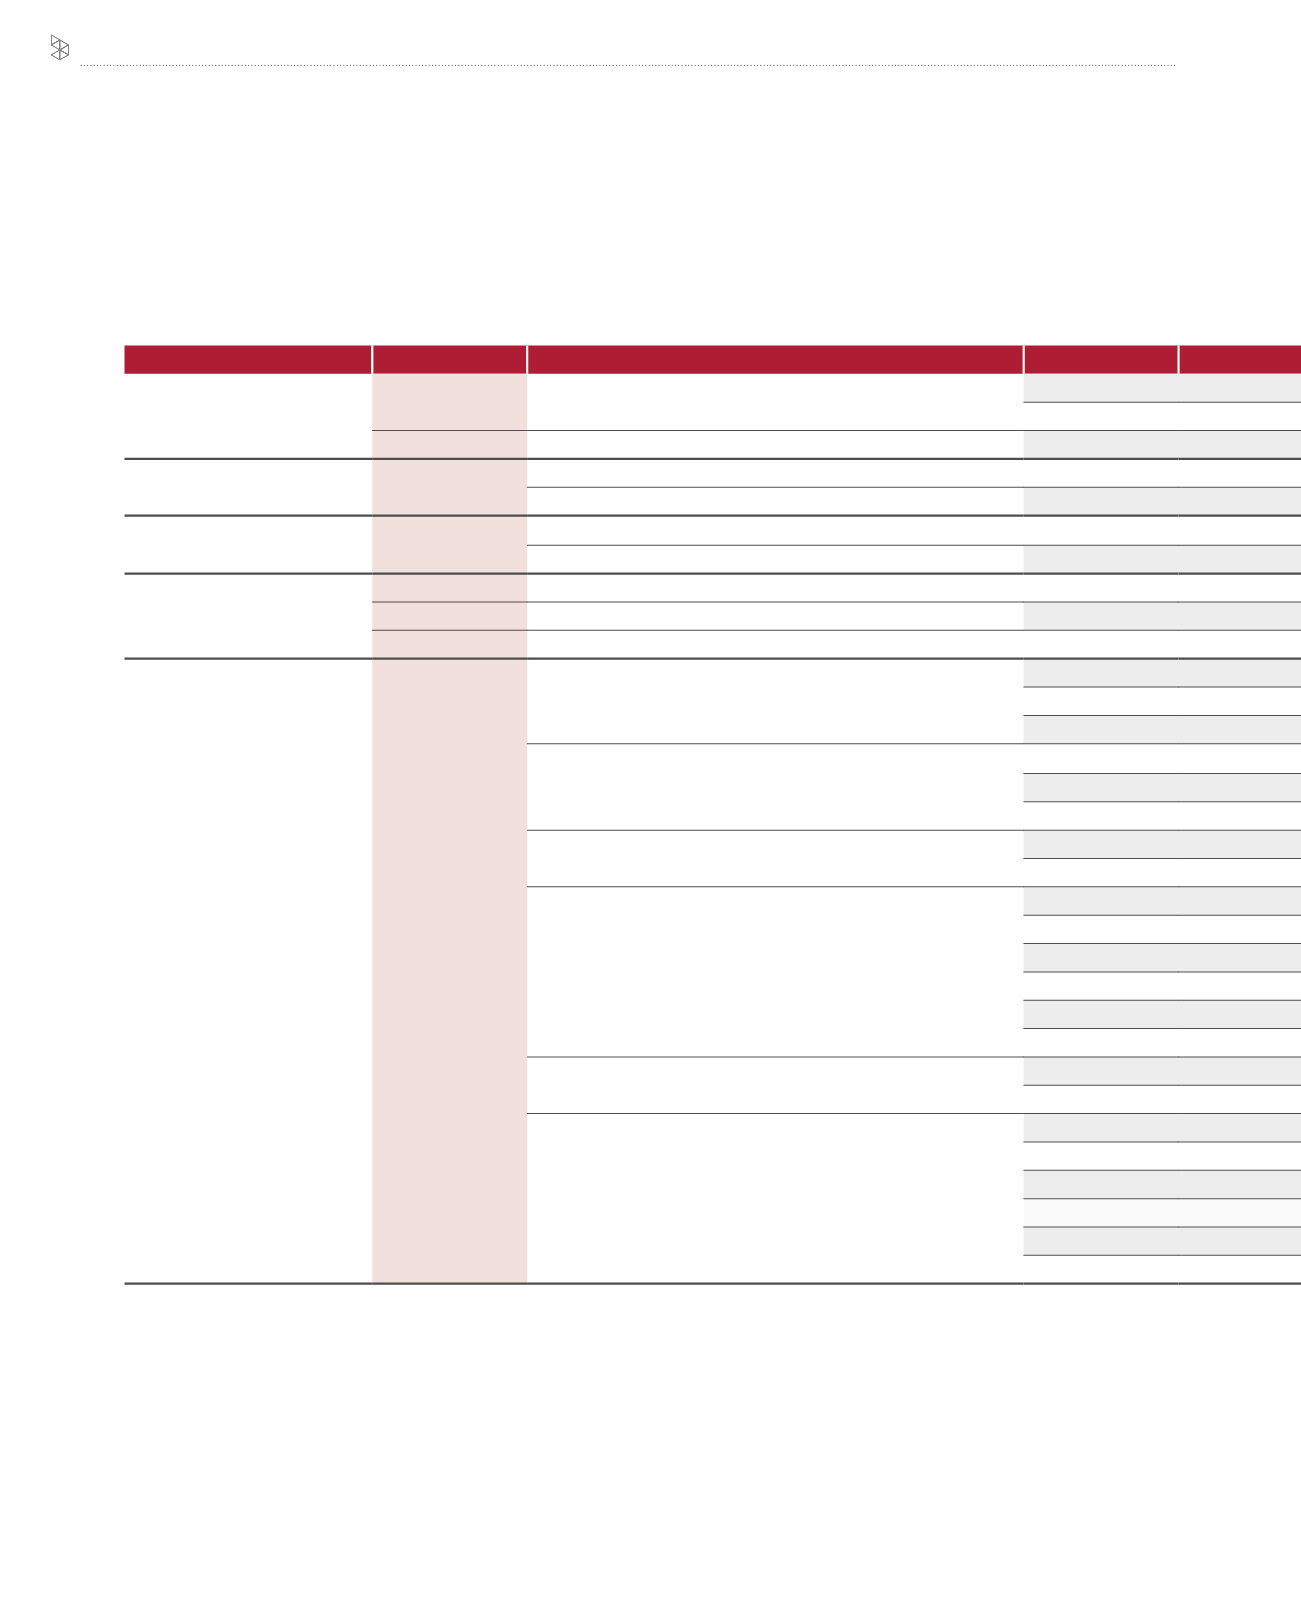
Data in Numbers
Aspect
Indicator
Detail
Market Presence
EC5
Ratios of standard entry level wage vs local minimum wage
a
Male
Female
EC6
Proportion of senior management from local country
%
Procurement Practices
EC9
Percentage local
%
Percentage foreign
%
Energy
EN3
Direct energy consumption
b
GJ
Indirect energy consumption
GJ
Emissions
EN15
Scope 1 GHG - GHG from fuel
d
Tonnes
EN16
Scope 2 GHG - GHG from grid
Tonnes
EN19
Reduction of GHG
Tonnes
Employment
LA1
Employees by gender
Male
Female
Total employees
Workforce
l
Male
Female
Total employees
Joining the Group - By Gender
Male
Female
Joining the Group - By Age Group
<20
20-29
30-39
40-49
50-59
> 60
Leaving the Group - By Gender
Male
Female
Leaving the Group - By Age
<20
20-29
30-39
40-49
50-59
> 60
Notes:
a
Reference page 91 for definitions
b
Conversion from diesel and petrol to energy was performed using imperial conversion values
c
edotco energy and emissions data is added to the respective OpCo data for each country
d
Source of reference for emission factors used to calculate the GHG emissions resulting from direct energy: Department for Environment, Food and Rural Affairs (DEFRA)
2015 emission factor database
e
GHG protocol tool was used for calculating the grid GHG emissions for Malaysia,
http://www.ghgprotocol.org/calculation-tools/all-tools.f
Emissions factor for Indonesia was derived using the IEA Statistics 2015 document from sections: Electricity output and CO
2
emissions by sector in 2013, to calculate grid
GHG emissions
g
Emissions factor for Sri Lanka was derived using
www.info.energy.gov.lk/content/pdf3/2014%20Energy%20Balance.pdfand EIA 2016 edition - CO
2
emissions by sector
in 2014 to calculate the grid GHG emissions for Sri Lanka