
MANAGEMENT DISCUSSION & ANALYSIS
Axiata Group Berhad | Annual Report 2016
023
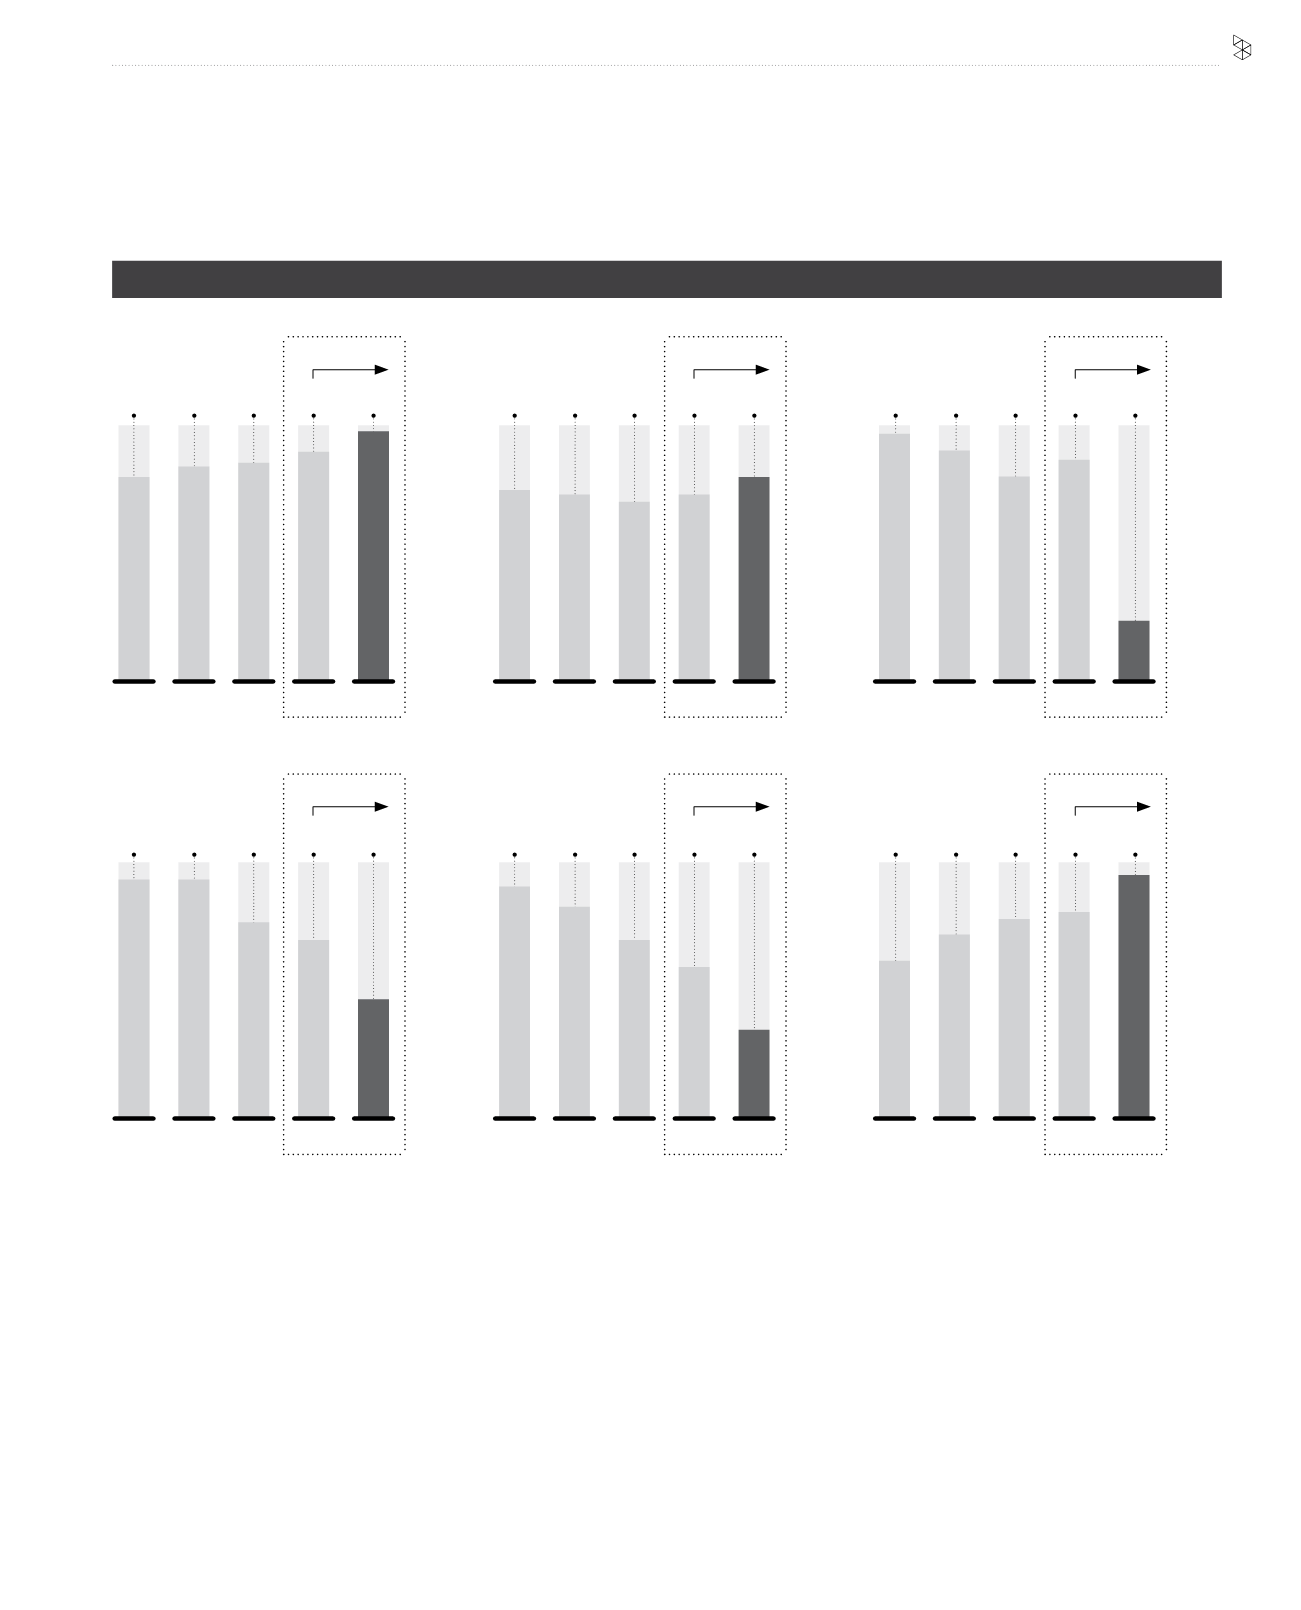
PAT
(RM Billion)
Normalised PATAMI*
(RM Billion)
EBITDA
(RM Billion)
ROIC
(%)
Subscribers
(Million)
Operating Revenue
(RM Billion)
18.7 19.9
21.6
18.4
17.7
7.0 7.3
8.0
7.3
7.4
2.4 2.6
0.7
2.7
2.9
Note 1 - 2012 normalised PATAMI excludes Celcom tax incentive (-RM110.0 million), Celcom Sukuk related costs (+RM26.3 million), Celcom network
impairment (+RM161.6 million), Dialog tax impact (-RM47.8 million), Hello asset impairment (+RM46.0 million), Robi SIM tax (+RM34.4 million) and foreign
exchange loss (+RM161.3 million).
Note 2 - 2013 normalised PATAMI excludes Celcom tax incentive (-RM106.0 million), Celcom network impairment (+RM67.5 million), Robi physical count
loss and impairment on receivables (+RM16.7 million), Smart asset write-off (+RM31.4 million) and foreign exchange loss (+RM201.3 million).
Note 3 - 2014 normalised PATAMI excludes gain on disposal of Samart i-Mobile (-RM116.7 million), XL gain on disposal of towers (-RM48.2 million) and
foreign exchange loss (+RM55.5 million).
Note 4 - 2015 normalised PATAMI excludes XL gain on disposal of towers (-RM399.8 million), Sri Lanka tax impact (+RM49.0 million) and foreign
exchange gain (-RM132.3 million).
Note 5 - 2016 normalised PATAMI excludes XL gain on disposal of towers (-RM339.6 million), XL accelerated depreciation (+RM193.3 million), Ncell
purchase price allocations (+RM105.5 million), Robi accelerated depreciation (+RM110.5 million), Robi-Airtel merger one-off adjustments (+RM20.2
million) and foreign exchange loss (+RM824.1 million).
* On normalised PATAMI, derivative gains/losses were not normalised prior to 2014. Derivatives losses in FY14 was RM22.5 million, gains in 2015 was
RM49.5 million while loss in 2016 was RM77.1 million.
2.3 2.1
1.4
2.8
2.8
9.0 7.7
4.5
10.7
11.8
266 275
320
244
205
2014
2014
3
2014
2014
2014
2014
2015
2015
4
2015
2015
2015
2015
2013
2013
2
2013
2013
2013
2013
2012
2012
1
2012
2012
2012
2012
2016
2016
5
2016
2016
2016
2016
+8%
-32%
+10%
-3.2pp
-75%
+16.4%
GROUP FINANCIAL HIGHLIGHTS


