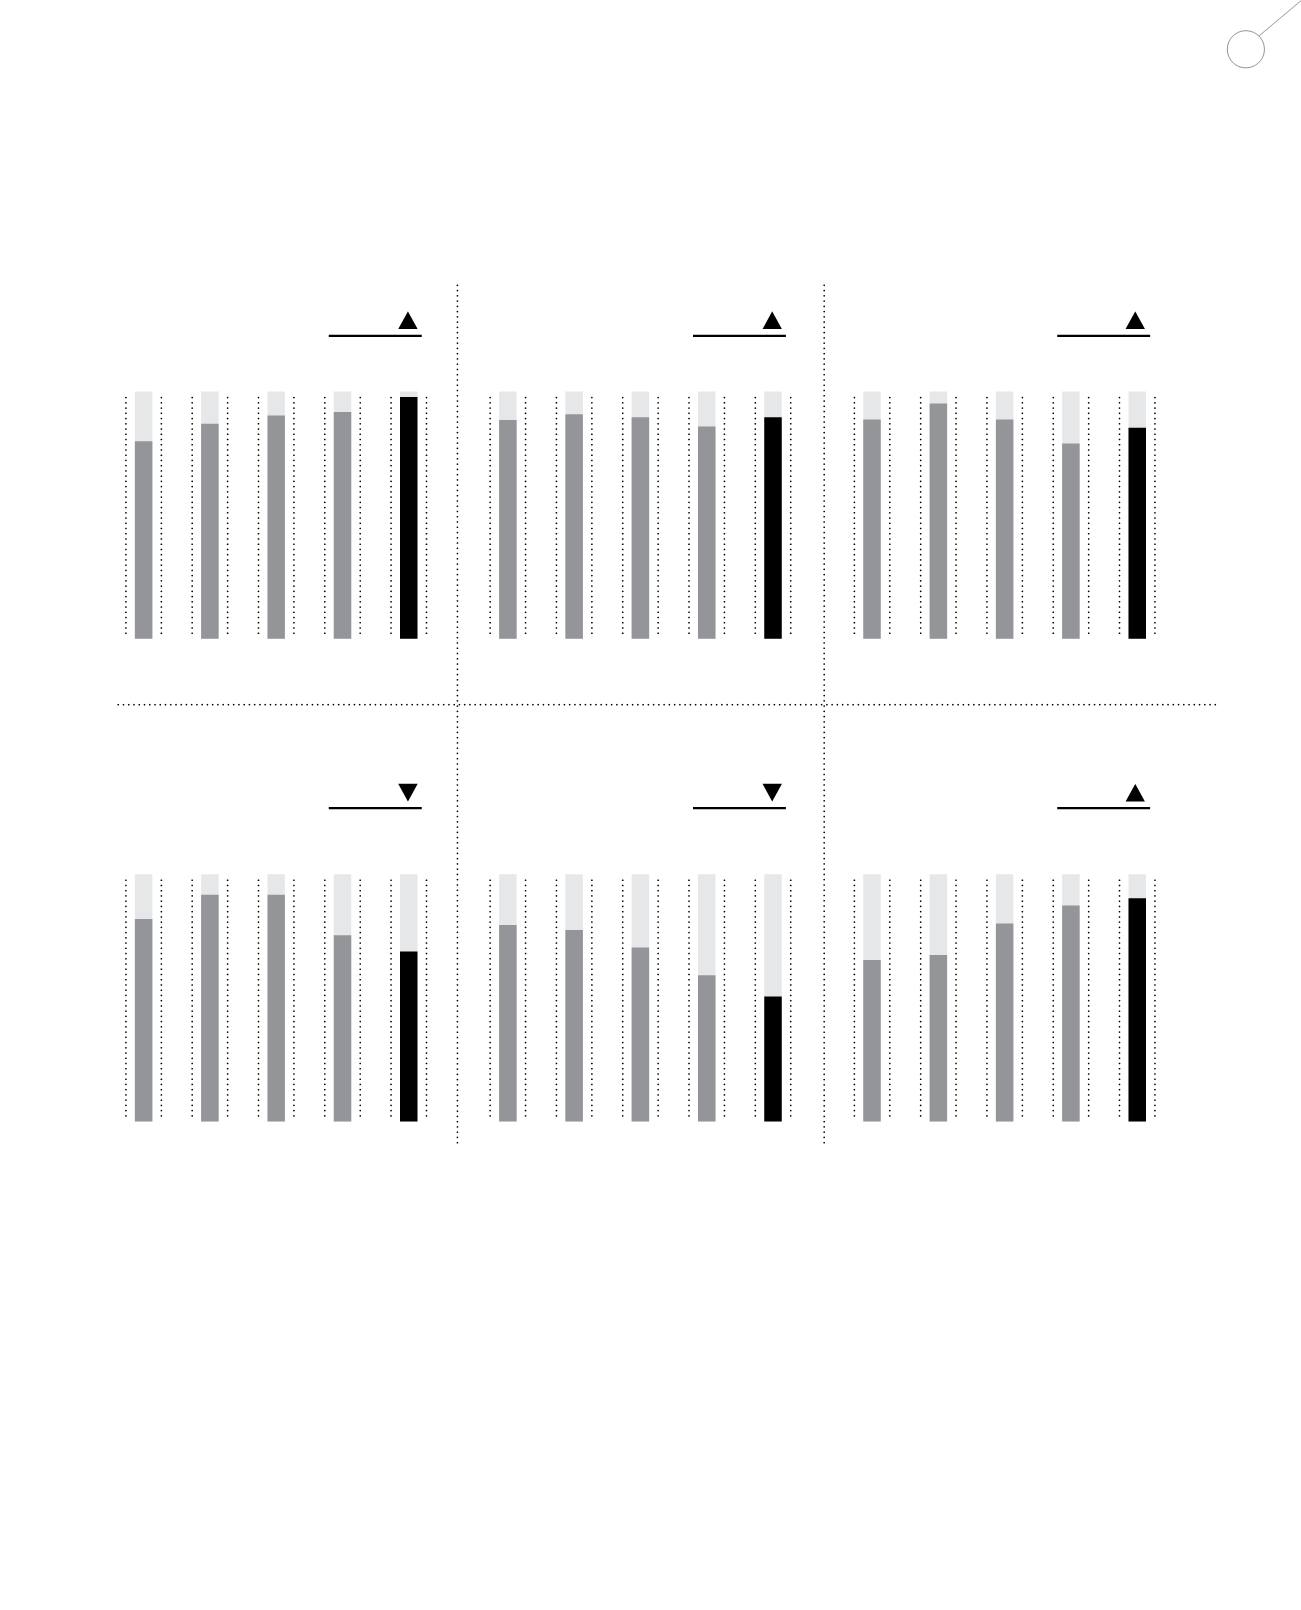
FIVE-YEAR GROUP
FINANCIAL HIGHLIGHTS
PAT
(RM Billion)
NORMALISED PATAMI*
(RM Billion)
EBITDA
(RM Billion)
ROIC
(%)
SUBSCRIBERS
(Million)
OPERATING REVENUE
(RM Billion)
18.7
19.9
+6%
+4%
+11%
18.4
17.7
16.3
7.0
7.3
7.3
7.4
7.2
2.4
2.6
2.7
2.9
2.7
2014
2013
2012
2011
2015
2014
2013
2012
2011
2015
2014**
2013
2012
2011
2015
Note 1 - 2011 normalised PATAMI excludes acquisition and provision (+RM107.7 million), XL severance payment (+RM46.8 million), Celcom network
impairment (+RM105.1 million), Celcom tax incentive (-RM140.0 million) and foreign exchange loss (+RM73.2 million).
Note 2 - 2012 normalised PATAMI excludes Celcom tax incentive (-RM110.0 million), Celcom penalty on Sukuk (+RM26.3 million), Celcom network
impairment (+RM161.6 million), Dialog tax impact (-RM47.8 million), Hello asset impairment (+RM46.0 million), Robi SIM tax (+RM34.4 million) and foreign
exchange loss (+RM161.3 million).
Note 3 - 2013 normalised PATAMI excludes Celcom tax incentive (-RM106.0 million), Celcom network impairment (+RM67.5 million), Robi physical count
loss and impairment on receivables (+RM16.7 million), Smart assets write-off (+RM31.4 million) and foreign exchange loss (+RM201.3 million).
Note 4 - 2014 normalised PATAMI excludes gain on disposal of Samart i-Mobile (-RM116.7 million), XL gain on disposal of towers (-RM48.2 million) and
foreign exchange loss (+RM55.5 million).
Note 5 - 2015 normalised PATAMI excludes XL gain on disposal of towers (-RM399.8 million), Sri Lanka tax impact (+RM49.0 million) and foreign
exchange gain (+RM132.3 million).
* On normalised PATAMI, derivative gains/losses were not normalised prior to 2014. Derivatives losses in FY14 was RM22.5 million, while derivative gains
in FY15 was RM49.5 million.
** 2014 are based on Restated.
-8%
-1.3pp
+3%
2.3
2.1
2.8
2.8
2.5
9.0
7.7
10.7
11.8
12.1
266
275
244
205
199
2014**
2013
2012
2011
2015
2014
2013
2012
2011
2015
2014
2013
2012
2011
2015
axiata group berhad | annual report 2015
023


